JobTrack:
Intelligent Job Search
A job-search tracker with a drag-and-drop pipeline, conversion analytics and a Gemini layer that reads your own application history back to you. Built as a static React 19 SPA on Firebase — with a six-model fallback chain so the free-tier quota running out is not the same thing as the feature breaking.
CORE CAPABILITIES
Pipeline Insights
Gemini reads your own application history — roles, stages and dates — and returns two to four specific observations.
Kanban Workflow
Four stages, drag-and-drop between them, built on the native HTML5 API with no library.
Conversion Analytics
Response, interview and offer rates computed from the loaded pipeline and drawn with Recharts.
Note Summaries
Interview notes for one application condensed into a summary plus a short list of takeaways.
Three Sign-in Paths
Google and GitHub via popup OAuth, plus email and password, all through Firebase Auth.
No Server to Run
A static SPA talking straight to Firestore and Gemini — there is no backend of my own to deploy.
Application Interface
A dark, “command-center” interface — drag-and-drop pipeline, data-dense analytics, and AI assistance, designed for clarity and focus.
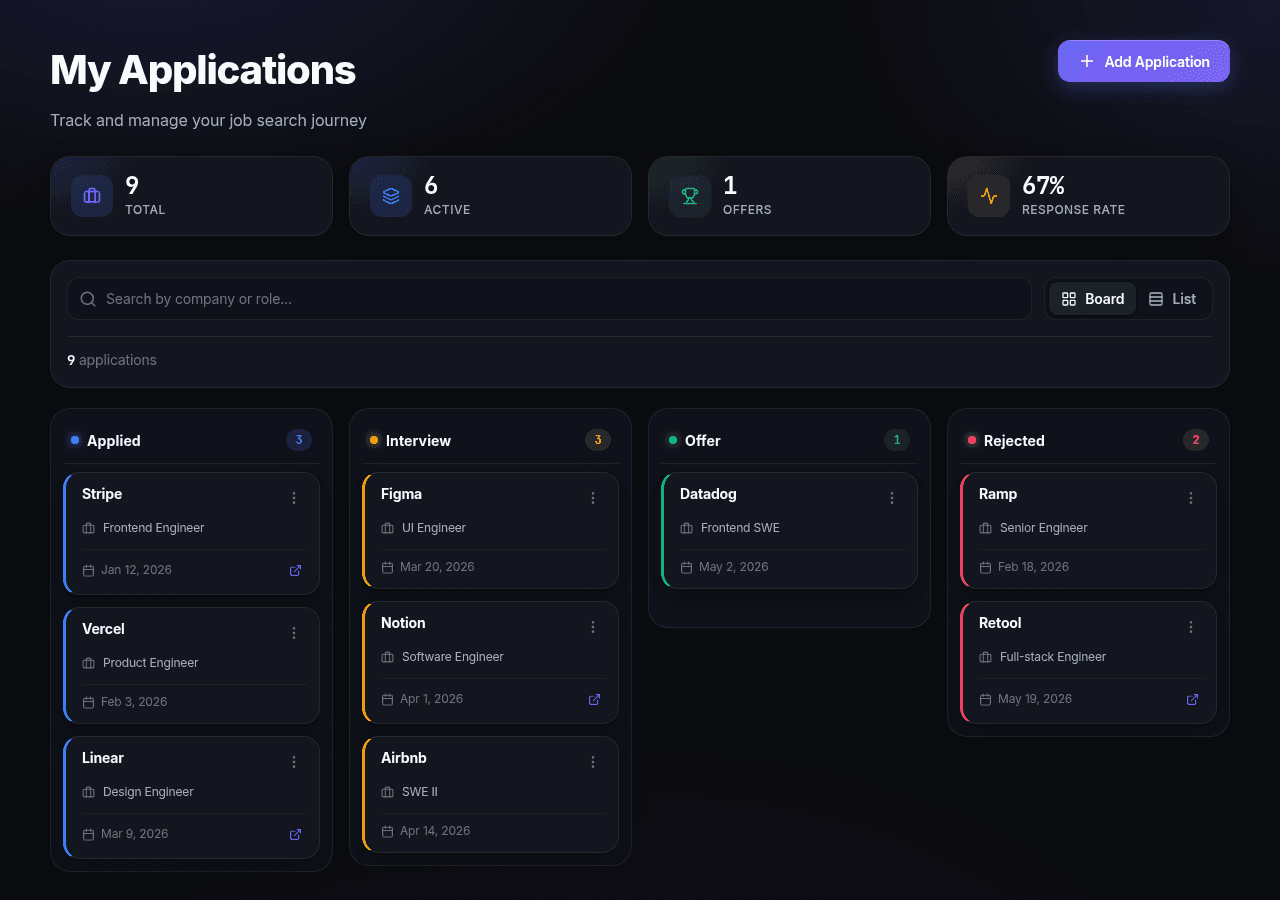
Kanban Pipeline
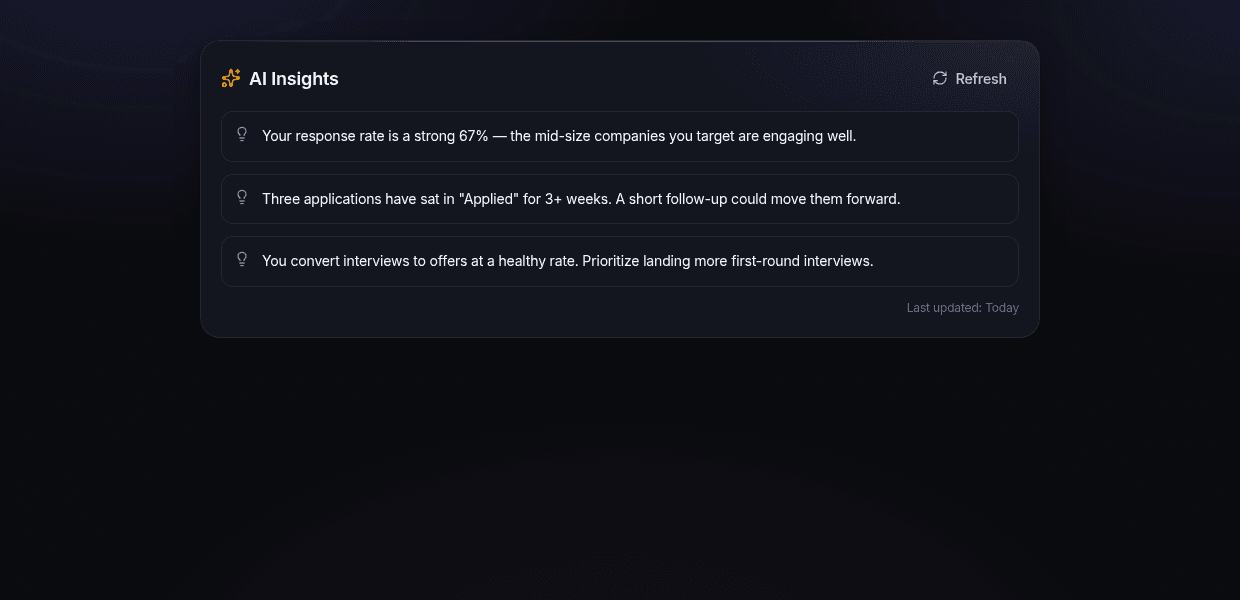
Gemini AI Insights
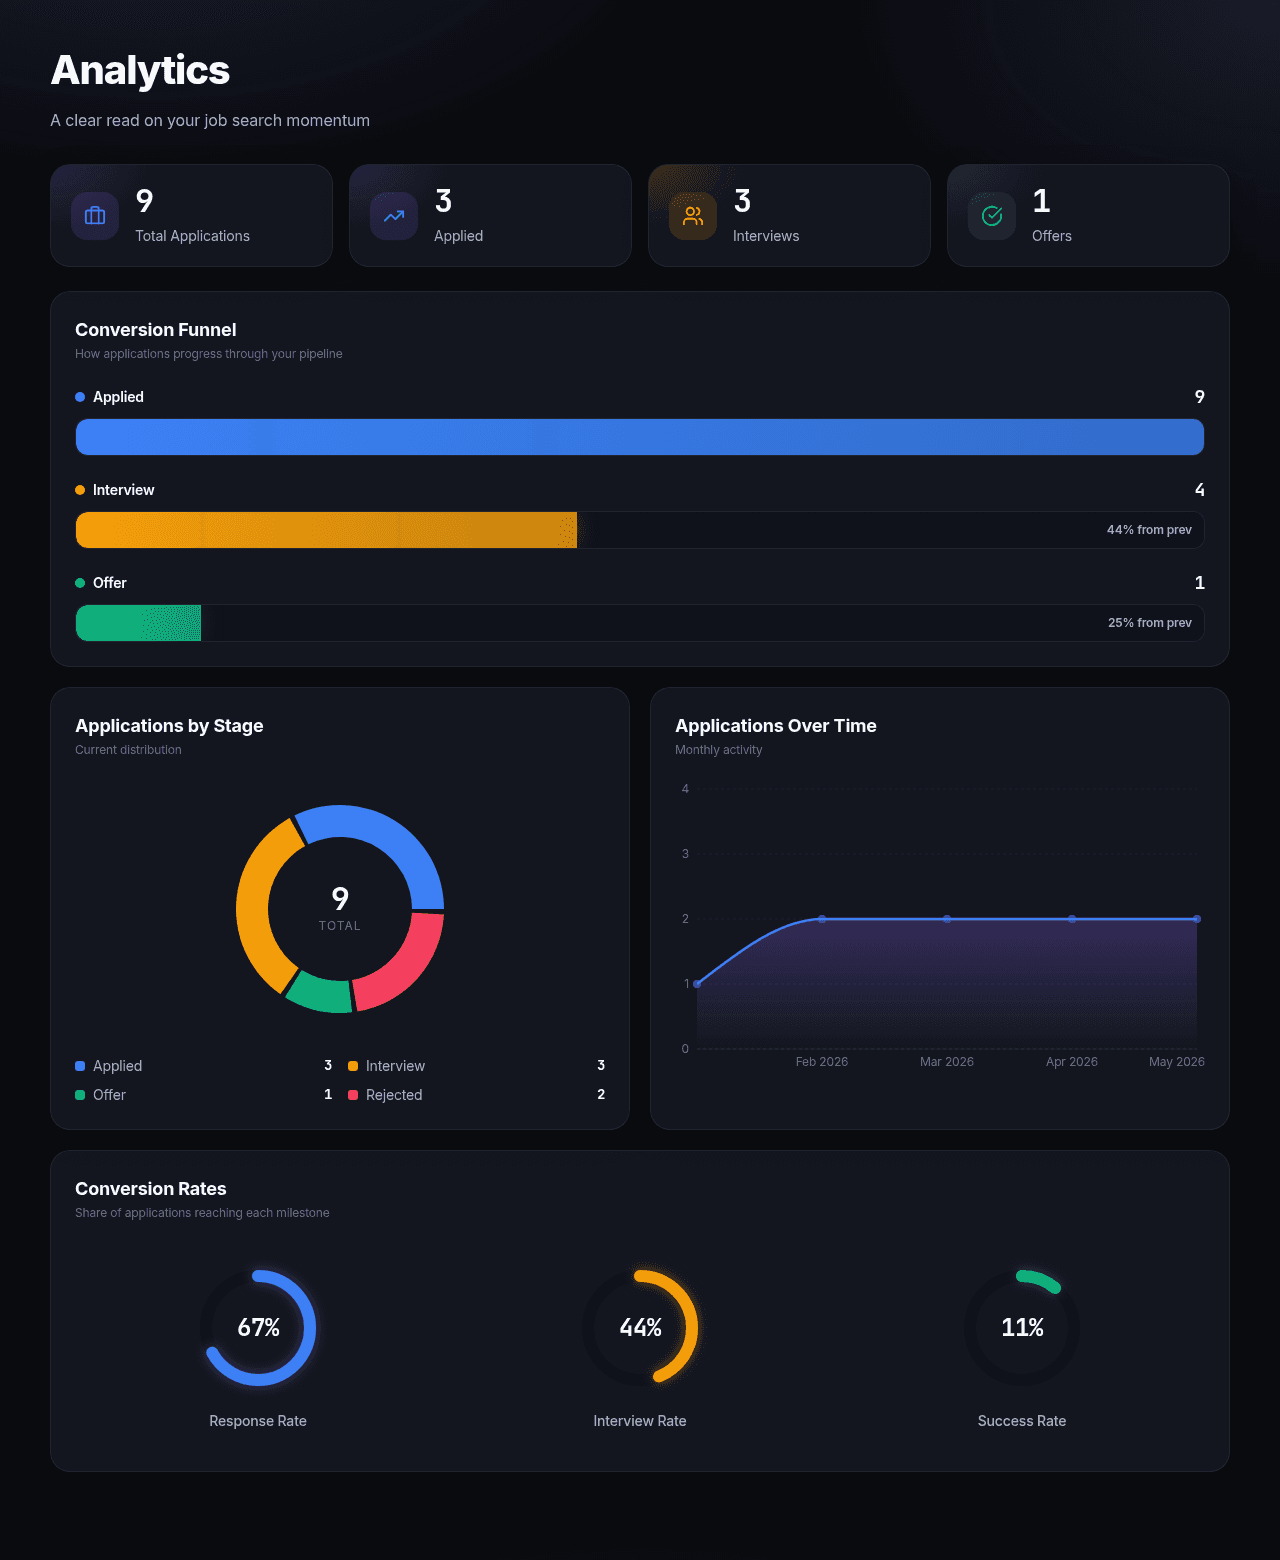
Analytics & Conversion
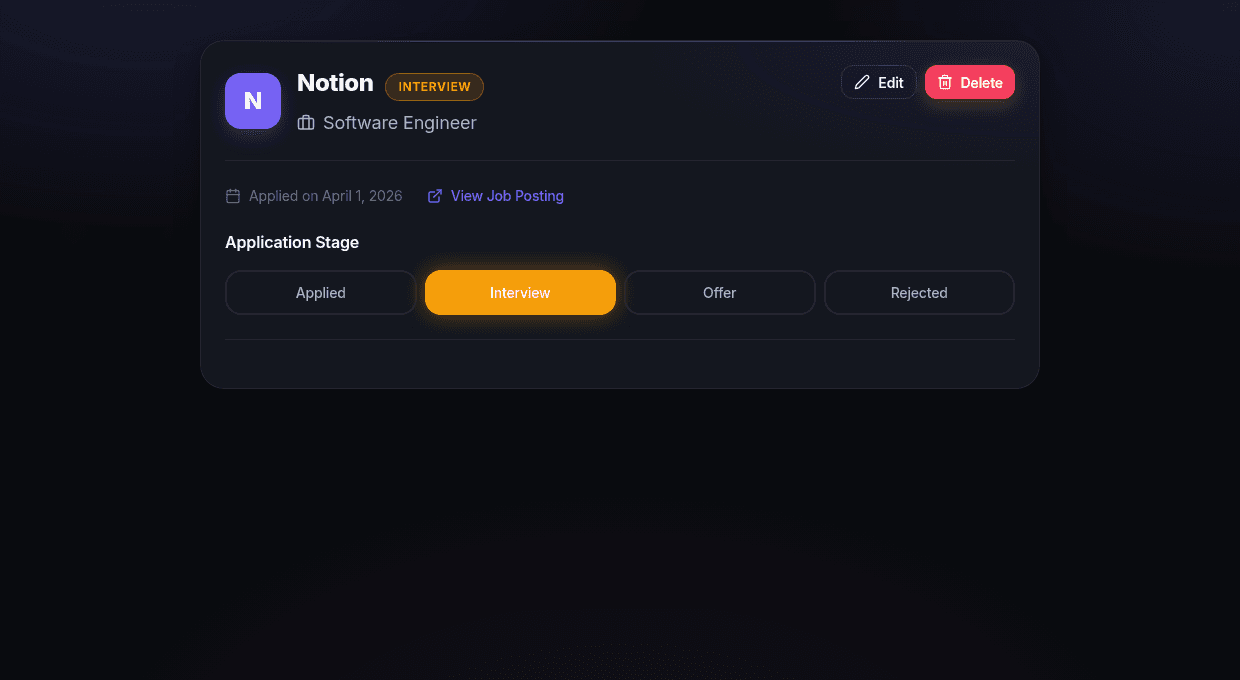
Application Detail
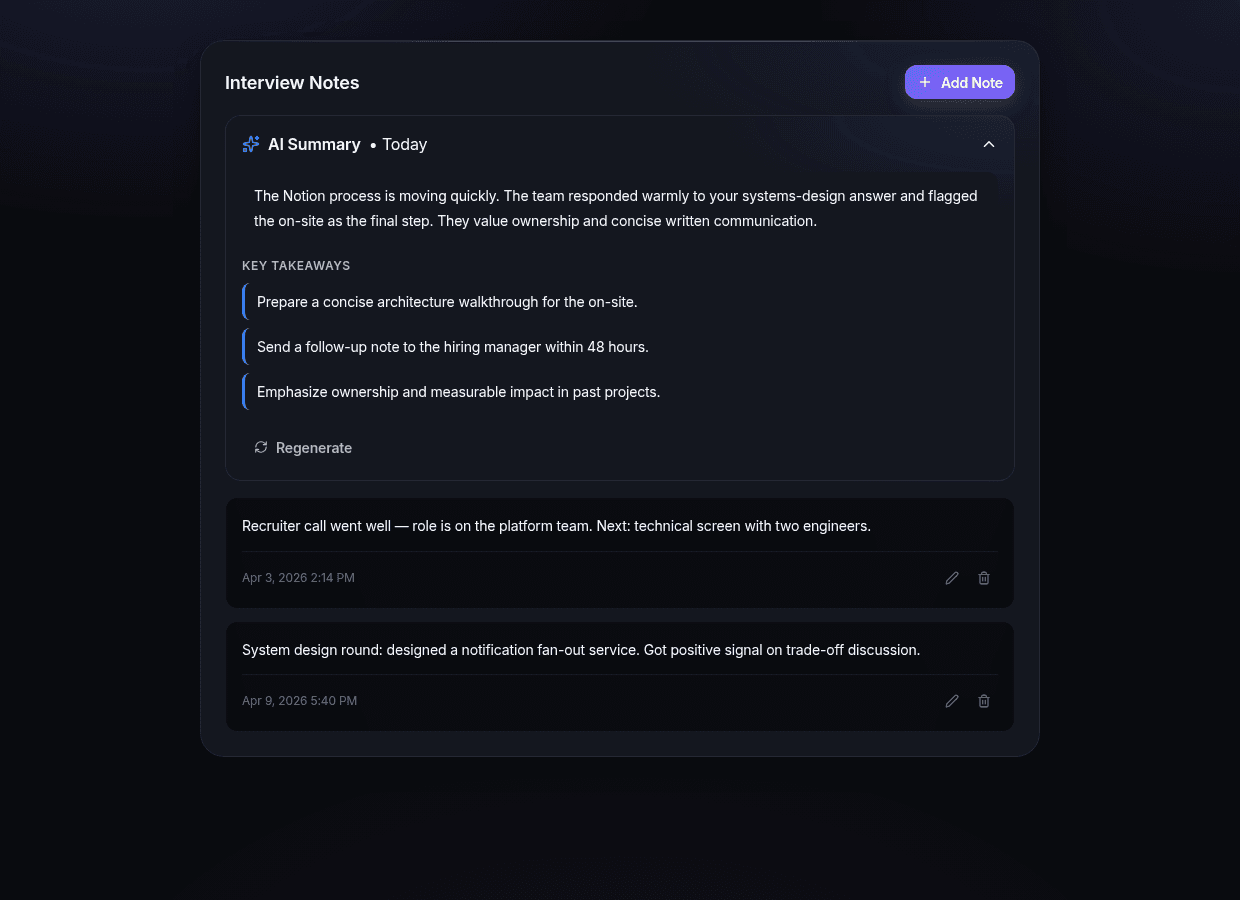
AI Note Summaries
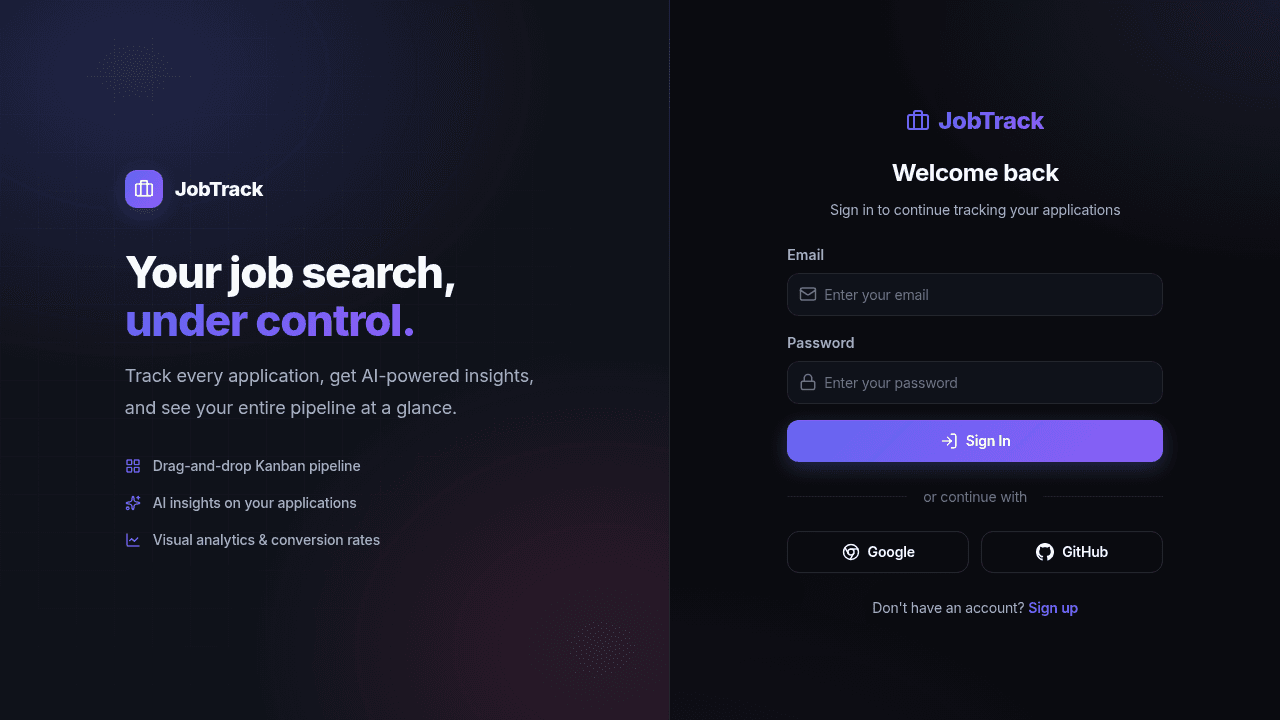
Split-Brand Auth
The AI layer
Six models deep, because the quota is free
This runs on Gemini's free tier. The failure mode that matters is not a bad answer, it is a 429 at the moment someone opens the dashboard. So the generation call is not a call to a model — it is a walk down an ordered chain, best model first, returning the first response that comes back.
THE CHAIN, IN ORDER
A user on a quiet day gets the top of the list. A user at peak gets something further down and never learns that they did. The chain degrades quality quietly rather than availability loudly, which for a nice-to-have panel is the right way round.
FOUR RULES AROUND IT
Exhaustion is a routing signal, not an error
A failure is classed as a rate limit if the message carries 429, 503, 'rate limit', 'quota exceeded' or 'resource exhausted'. That class moves to the next model in the chain rather than surfacing to the user.
Which model ran out is written down
Each rate-limited model is appended — with arrayUnion, so the entry is idempotent — to an ai_rate_limits document keyed by today's date. Over time that document says which tiers are actually reachable on the free quota on a given day.
Only the last failure is reported
If all six models fail, the error raised carries the last model's message rather than a generic one, so the cause is still legible after six silent retries.
Insights are cached for seven days
Generated insights are stored per user and reused until they are a week old, or until the user explicitly forces a refresh. Opening the dashboard does not spend a model call.
Scope
What the model is actually given
Worth being precise about, because it is easy to overstate. The insights prompt receives four fields per application — company, role, stage and application date. No résumé, no job description, no free text. The model is reasoning over the shape of a pipeline, not over the contents of a CV.
Two filters run before the prompt is built. Applications still sitting at Applied are dropped, because an application nobody has responded to carries no signal about why. What remains is sorted newest-first and capped at fifty, so the prompt stays a bounded size regardless of how long someone has been searching. If nothing survives both filters the feature says so plainly instead of calling a model to produce filler.
The prompt asks for two to four single-sentence observations and explicitly forbids bullets or numbering. The parser then strips any line that starts with a dash or a digit anyway, and hard-slices to four — the instruction is a request, the parser is the guarantee.
THE NOTE SUMMARISER
The second AI surface is narrower and gets a stricter contract. All notes attached to one application are sorted oldest-first, date- stamped, and the model is asked to answer in a fixed line protocol: a single SUMMARY: line followed by up to three TAKEAWAY: lines.
Parsing is then a prefix match rather than anything that has to understand prose — and if no summary line comes back at all, the first line of the response is used instead. A malformed answer degrades to a slightly worse summary rather than to an empty panel.
WHERE THE DATA SITS
Everything is namespaced under the signed-in user: users/{uid}/applications for the pipeline, users/{uid}/insights/latest for the cached analysis. There is no server of mine in the path at all — the browser holds the Firebase session and talks to Firestore and Gemini directly, which means Firestore security rules are the authorisation boundary rather than a layer of my own code.
The honest limitation of that shape: reads are one-shot fetches, not live subscriptions. Two tabs open side by side will not update each other until one of them reloads. Moving to live queries is a small change and mostly a question of whether the read volume is worth it for a tool one person uses at a time.
THE BOARD
Four stages — Applied, Interview, Offer, Rejected — and a drag between columns is the only way an application changes state. The drag is the browser's own: a card sets draggable, writes its id into the dataTransfer payload as plain text, and the column that receives the drop reads that id back out and writes the new stage. No drag-and-drop dependency is installed.
Rejected sits in the column list rather than being hidden, which is a product decision as much as a technical one — the rejection rate is the number the analytics view is mostly built to show, and a stage you cannot see is a stage you cannot reason about.
THE THREE RATES
None of the analytics are aggregated server-side. The pipeline is already fully loaded in the client, so the funnel, the stage distribution, the month-by-month activity series and the conversion rings are all derived from that one array in the browser.
The definitions matter more than the arithmetic. Response rate counts anything that moved off Applied — including rejections, because a rejection is still a reply. Interview rate counts everything that reached Interview or beyond, so an offer is never lost by having overtaken the stage that produced it. Success rate is offers over total.
The funnel is built the same way: the Interview step is the sum of interviews and offers, not just the cards currently parked at Interview. Treating a stage as terminal when it is really a milestone is the standard way these charts end up lying, and it is worth the two extra additions to avoid.
TECHNICAL ARCHITECTURE
frontend
React 19
Client-only SPA, no server of its own
TypeScript
Typed end to end
Vite 7
Build and dev server
backend
Firebase Auth
Google, GitHub and email/password
Cloud Firestore
Per-user document subcollections
Firebase Analytics
Usage instrumentation
ai
@firebase/ai
Gemini called from the browser
6-model fallback chain
Gemini 3 Pro down to 2.0 Flash
Rate-limit ledger
Exhausted models logged per day
ui
Recharts
Funnel, donut and area charts
Native HTML5 DnD
No drag-and-drop library
CSS Variables
Theming and design system